
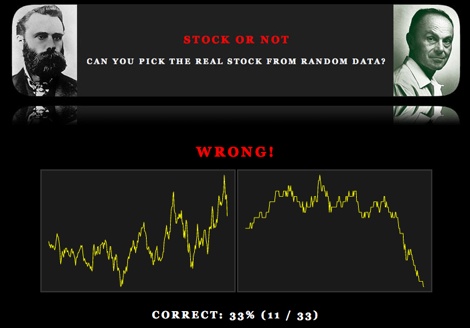
Some kind of genius: Stock or Not? Josh Reich has written a lovely little web app which puts two charts side by side. One is a real stock, the other is randomly generated. Can you tell which is which? I couldn’t:
Mathematically, one would expect half the people taking this test to get scores over 50%, and half to get scores under 50%. I wonder what it would mean if a significant majority of people, like me, got scores well under 50%? (In fact, I got only one of the first five right: at that point I was down at 20%.)
NB: The app never ends: You can keep on clicking for as long as you like, and it will give you a cumulative total. The more you click, the more accurately the percentage reflects your stock-chart-picking prowess.
While I’m very surprised at how many people have spent hours playing this silly little game, what really surprises me is that some people are doing significantly well at it.
It has now reached the time for me to pester my PhD econ buddy to suffuse me with some wisdom as to how to make more ‘realistic’ time series.
Just trying to do my bit to fight the good war against econterrorism 🙂