Doug Muir is a
bit late to the story that Transparency International has released its 2006
corruption perceptions index:
it actually came out back in November.
But he is good at getting people to create pretty charts for him, like this
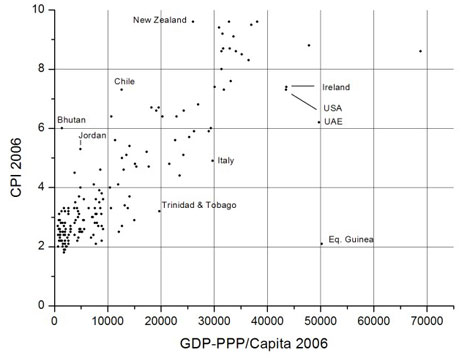
one from commenter Christian (click for larger version):
The chart has the corruption perceptions index on the y-axis, and PPP GDP per
capita on the x-axis. As you might expect, countries with lots of oil (Trinidad,
Equatorial Guinea, UAE) tend to be more corrupt than you might expect from their
wealth alone. And I’m sure that it comes as no surprise that Bhutan, Chile,
and New Zealand are the countries which outperform.
More interesting, however, as Muir’s commenter Cyrus points out, is the fact
that there seems to be a pretty strong correlation up until you reach a perceived
corruption of about 7/10. After that level, the correlation seems to break down
quite spectacularly. Says Cyrus:
Diminishing returns to honesty? Or are people naturally somewhat dishonest,
and forcing them to be even more honest than they are inclined to be demands
a very costly enforcement effort?


Felix —
Some corruption is a good thing! Corruption is part of the developmental process. As Sam Huntington (1968) argued, corruption is the means by which groups in society who might otherwise not have a say in the political process are able to develop a stake in the process when institutions are too weak to adapt through legitimate channels. This in the short-term minimally ensures stability and reduces the likelihood of violence during transformative social changes like rapid economic development and structural reform.
But now more importantly for the sexy corruption quote from Hollywood’s Syriana:
“Some trust fund prosecutor, got off-message at Yale, thinks he’s gonna run this up the flagpole, make a name for himself, maybe get elected some two-bit, congressman from nowhere, with the result that Russia or China can suddenly start having, at our expense, all the advantages we enjoy here. No, I tell you. No, sir. Corruption charges! Corruption? Corruption is government intrusion into market efficiencies in the form of regulations. That’s Milton Friedman. He got a goddamn Nobel Prize. We have laws against it precisely so we can get away with it. Corruption is our protection. Corruption keeps us safe and warm. Corruption is why you and I are prancing around in here instead of fighting over scraps of meat out in the streets. Corruption is why we win.”
Diminishing returns to honesty? Or are people naturally somewhat dishonest, and forcing them to be even more honest than they are inclined to be demands a very costly enforcement effort?
Why the “or”? That looks like the definition of diminishing returns to me. Each marginal increment of x gets you a smaller return in y.
Felix —
I might just be ignorant, but why would we presume that a microlevel case of diminishing returns would even be reflected in macrolevel data?
Further, it might be that my statistical training is poor, but I am not sure why from the graph you posted you are suggesting that at around 7/10 the linear correlation totally breaks down. I seems to me that a few countries – about 4 or so in the upper right hand side of the graph are deviating substantially from the trend line. That deviation may be for important reasons, but I would certaintly not jump to suggest that the linear curve therefore does not fit the data well. Visually, it seems to do an impressive job. That of course — doesnt imply clearly to me what the mechanism explaining the relationship in the data actually is, and I certaintly don’t see a diminishing returns type curve — but I might just need glasses!