
Yves Smith at Naked Capitalism submits:
Michael Shedlock, of Mish’s Global Economic Trend Analysis, provides some uplifting charts and commentary that should quash any doubts that this housing cycle is worse than its predecessors:
….this housing cycle looks different than any I have seen. To this point, I have included two charts. I suggest studying them carefully. What you find is that the 1988-1992 housing cycle peaked in the first quarter of 1988 (1Q88) followed by a decline in “For Sale Inventories” until the cycle troughs in the 4Q ’91 (some 15 quarters later, which is typical).
Housing Inventory 1988-1992 vs. 2004-Present
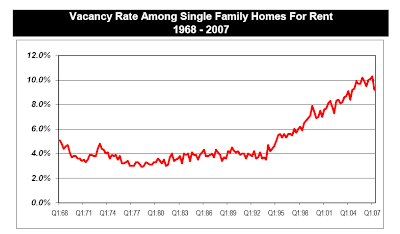
Housing Vacancy Rates 1968-2007

In case the charts are hard to read, the pink line in the top chart is our current housing inventory level, while the blue line is the 1988-1992 inventory line. Shedlock’s point is twofold: in the last cycle, inventory peaked in 1988, but the market prices continued to tank until inventory levels had fallen, which took almost four years. Second, look how dizzyingly much higher current inventory levels are relative to housing stock than they were last time around.
And his second chart shows that houses for sale have plenty of competition from a rental market that also has a lot of slack.
The Prudent Investor offered this related factoid:
The Boston Globe runs a story that says credit card offers aimed at subprime debtors jumped 41% in the first half of 2007. Offers to those in the best credit grade fell 13%, paradoxically. Debtors paying their mortgage with their credit card. And you still want to own bank shares?